As an admin user, on the comparison graphs (located under reviews in the main navigation), reports can be generated across all employees by selecting all (or picking specific individuals or departments) and selecting which type of report you would like to generate. (Under Generate Reports at the bottom of the screen).
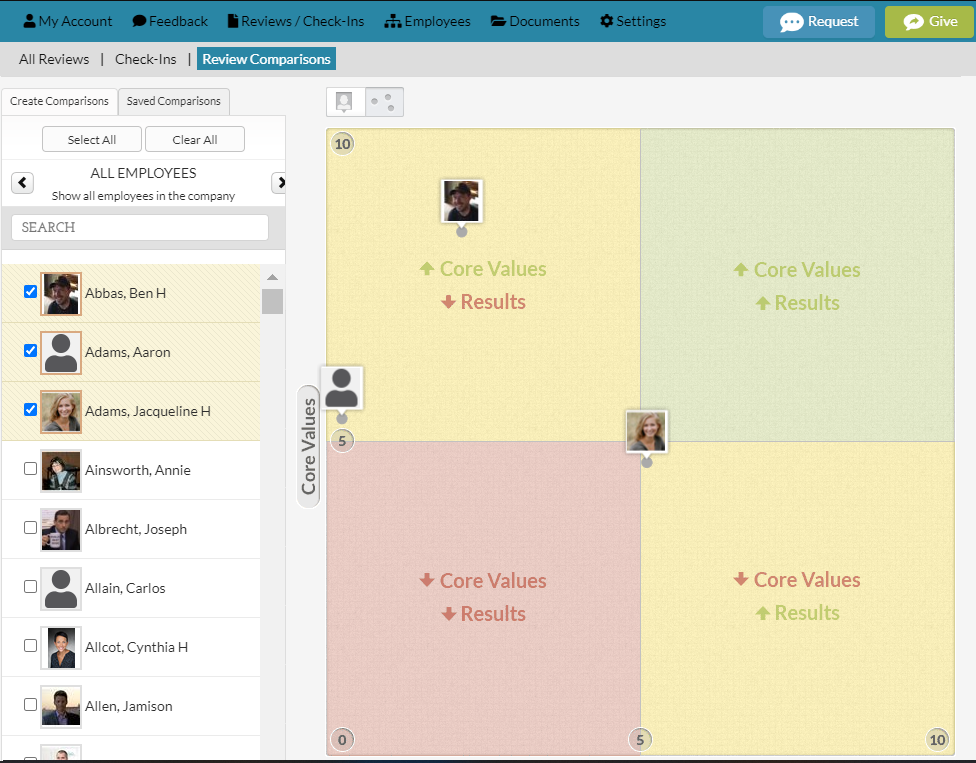
Many customers also use the comparison graph to help with distributing raises and or bonuses. This graph view allows you to view everyone in the organization's most recent review score within Threads.
If you want to see reviews over time on the graph, go to “Reviews” and then select “All Reviews”.
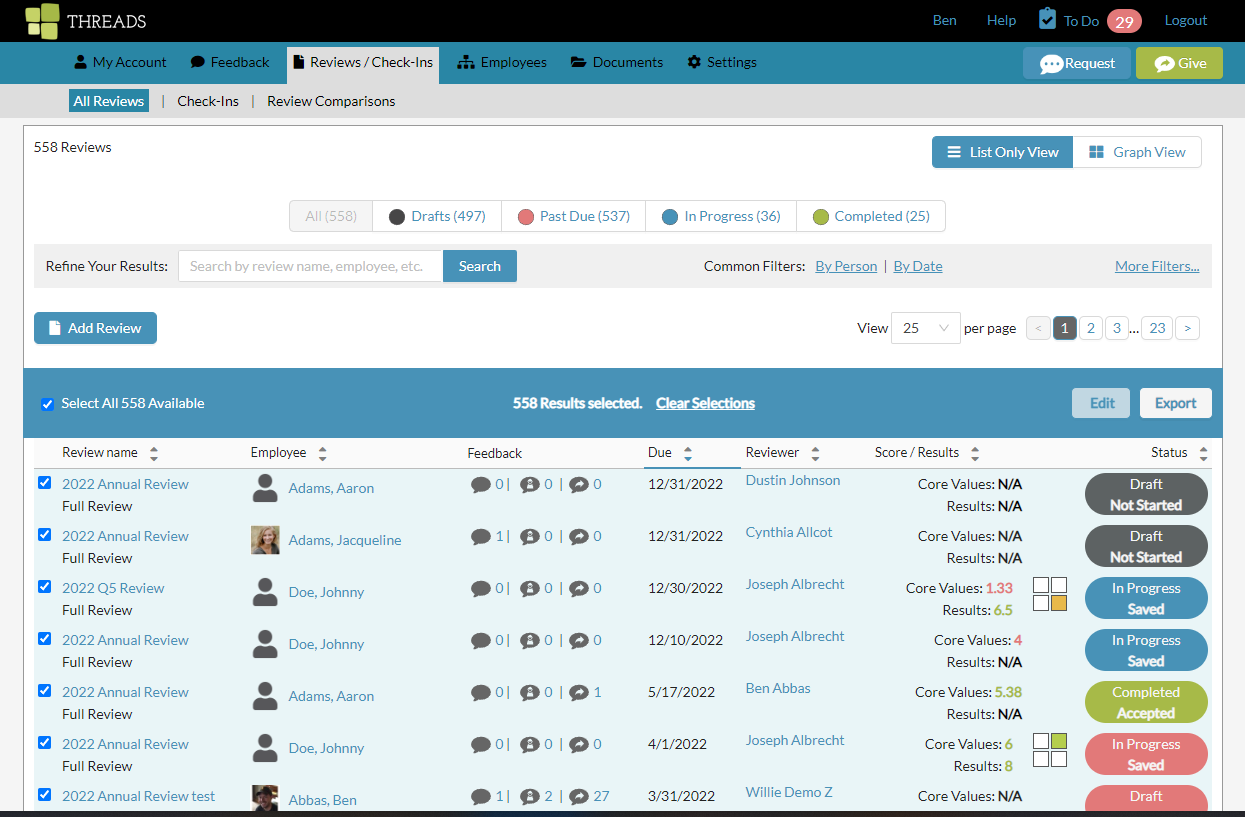
From there, click on “Graph View” on the top right.

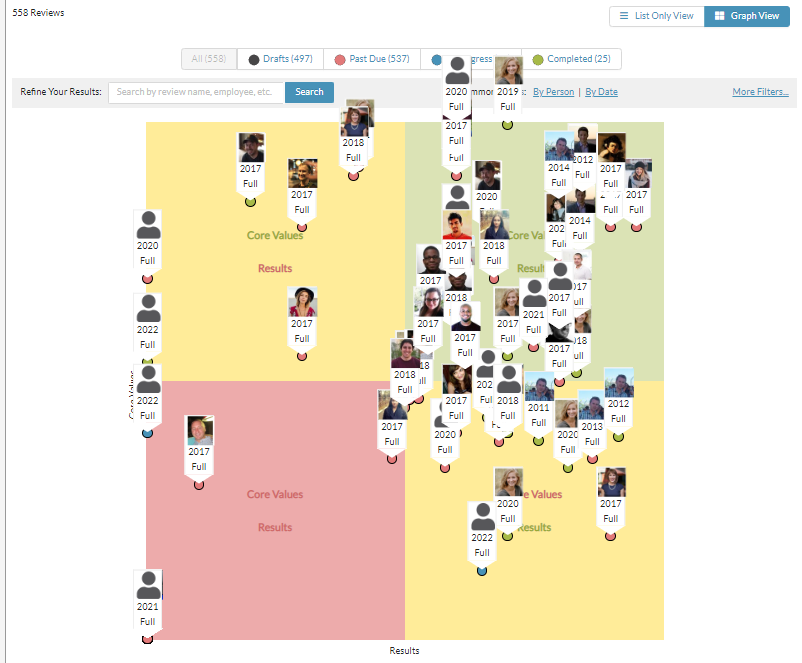
You can now toggle to different statuses, or apply filter to see different variations of reviews placed on the graph.

If you want to see the actual individuals on the graph, instead of anonymous dots, Select all the reviews listed below the graph.
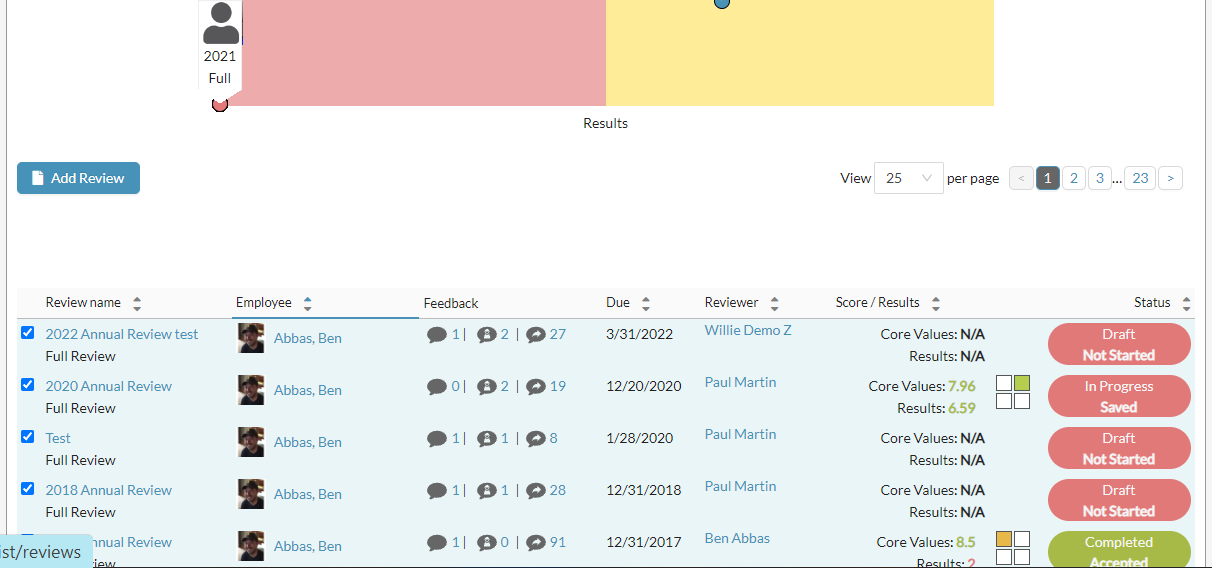
And watch the graph be automatically updated with individuals on the graph.
0 Comments